The Merge Sort — Python Code

I have just begun working on a MOOC on algorithms offered by Stanford. Since this course gives us the liberty to choose a programming language, there isn’t any code discussed in those lectures. I plan to convert any algorithm discussed in those lectures into Python code. Since Merge Sort was the first algorithm discussed, I’m starting with that.

Merge Sort is supposedly a good introduction to divide and conquer algorithms, greatly improving upon selection, insertion and bubble sort techniques, especially when input size increases.

Pseudocode:

— Recursively sort the first half of the input array.
— Recursively sort the second half of the input array.
— Merge two sorted sub-lists into one list.

C = output [length = n]
A = 1st sorted array [n/2]
B = 2nd sorted array [n/2]
i = 0 or 1 (depending on the programming language)
j = 0 or 1 (depending on the programming language)

for k = 1 to n

if A(i) < B(j)
C(k) = A(i)
i = i + 1

else if A(i) > B(j)
C(k) = B(j)
j = j + 1

Note: the pseudocode for the merge operation ignores the end cases.

Visualizing the algorithm can be done in 2 stages — first, the recursive splitting of the arrays, 2 each 2 at a time, and second, the merge operation.

Merge-sort-example-300px MergeSort

Here’s the Python code to merge sort an array.

# Code for the merge subroutine
def merge(a,b):
""" Function to merge two arrays """
c = []
while len(a) != 0 and len(b) != 0:
if a[0] < b[0]:
c.append(a[0])
a.remove(a[0])
else:
c.append(b[0])
b.remove(b[0])
if len(a) == 0:
c += b
else:
c += a
return c
# Code for merge sort
def mergesort(x):
""" Function to sort an array using merge sort algorithm """
if len(x) == 0 or len(x) == 1:
return x
else:
middle = len(x)/2
a = mergesort(x[:middle])
b = mergesort(x[middle:])
return merge(a,b)
view raw mergesort.py hosted with ❤ by GitHub

We can divide a list in half log2 n times where n is the length of the list. The second process is the merge. Each item in the list will eventually be processed and placed on the sorted list. So the merge operation which results in a list of size n requires n operations. The result of this analysis is that log2 n splits, each of which costs n for a total of nlog2 n operations.

Other Algorithms:
Karatsuba Integer Multiplication Algorithm
Quick Sort Python Code

Review: An Introduction to Interactive Programming in Python (Part 1)

This class (Part 1 of a 2-part course on interactive programming using Python – and the first course of the Fundamentals of Computing Specialization offered by RICE Unviersity) was an excellent introduction to programming because of its focus on building interactive (and fun) applications with the lessons learned each week. Most introductory coding classes start with text based (boring?) programs, while all through this course you’re required to build a series of projects that get progressively complicated with every passing week. I’m not to be mistaken to be trashing conventional pedagogy, but then again, how many gifted coders do you know who learned to code after completing all the exercises, cover-to-cover of some programming textbook? The best way to learn to enjoy coding would be to build interactive stuff, and this course scores full points on that.

A short introduction to the class in a charmingly nerdy way

The mini-projects / assignments during the course are implemented on a cloud-based environment called CodeSkulptor (built by Scott Rixner, one of the instructors for this course). I found CodeSkulptor unique, in that it allows you to share your code (because it’s browser based) with just about anyone with an Internet connection and makes you work with a graphic user interface (GUI) module similar to Pygame, called Simplegui. It also had a debugging tool, called Viz Mode that helped visualize the process. It eases the task of debugging your code and you’ll realize how cool it is as you start using it more.

Since the course mini-projects were peer-reviewed, evaluating other people’s code also became a more straight-jacket affair, as everyone has their code on the same version of Python. This ensures that the focus is on learning to code, without wasting time on the logistics of programming environment (tuning differences in versions or IDEs). I especially enjoyed peer grading – for each mini project we completed, we had to evaluate and grade the work of 5 others. This was very rewarding – because I got the opportunity to fix bugs in others’ code (which makes you a better coder, I guess) and also got to see better implementations than the ones I had coded, further enriching the learning experience. Indeed, the benefits of peer grading and assessment have been well studied and documented.

Of all the assignments, the one I loved the most was implementing the classic arcade game Pong. You could try playing a version of the game I implemented here. It is a 2-player implementation, but you can play it as a single-player game, only if you imagine yourself to be answering this somewhat cheeky question! Which Pong character are you? Left or Right?

which pong

Which_Pong_Charater_Are_you

Pong v1.1

The principal reason behind my joining this course was the way it is structured and taught. We had to watch two sets of videos (part a and part b) and then complete one quiz for each set. The main task for each week was to complete a mini-project that was due along with the quizzes early Sunday morning, followed by assessment of peers’ mini-projects on the following Sunday-Wednesday. The instructors clearly put in A LOT OF WORK to make the lecture videos interesting, laced with humor, with just enough to get you going on your own with the week’s mini-project. That way you’d spend less time viewing the lecture videos, spending more time on actually getting the code for your mini-project to work. So in a way, one might say this course doesn’t follow standard pedagogy for an introductory programming course, but then, as Scott Rixner assures, “You’d know enough to be dangerous!

The projects that were completed in Part 1 of this course were indeed exciting:

Rock Paper Scissors Lizard Spock: A simple implementation played with the computer. This project covers basics on statements, expressions and variables, functions, logic and conditionals [I’m a huge fan of The Big Bang Theory, so I was obviously eager to complete this game. Instead of a series of if-elif-else clauses, this implementation used modular logic, all of which is taught in a really fun way. A great way to start off the course].
Guess the Number: Computer chooses a random number between 1 and 100 and you guess that number. It covered event-driven programming, local and global variables, buttons and input fields [This game although fun, might have been more interesting to code if the computer had to guess the number that the player chose, using bisection search].
Stopwatch: This was the first project that used a graphic user interface, using some modular arithmetic to get the digits of the ticking seconds in place. A game was also built on it where the player had to stop the watch right at the start of a second to score points. This game tested your reaction-time. It covered static drawing, timers and interactive drawing.
Pong: The last project of Part 1 and the most fun. Creating the game required only a minor step-up from learnings from previous weeks. It covered knowledge of lists, keyboard input, motion, positional/velocity control. Coding the ball physics where you put to use high-school physics knowledge of elasticity and collisions was very enjoyable. In my game, I set elasticity = 1 (for perfectly elastic collisions)

BallBounce

In an interview with the founders of this MOOC, who spent they say that they spent over 1000 hours building it (Part 1 and Part 2 combined, I guess). That’s an awful lot of effort and it all shows in how brilliantly the class is executed. The support system in the class is excellent. You’ll always find help available within minutes of posting your doubts and queries on the forums. I’ve seen Joe Warren (one of the main instructors of the course) replying to forum posts quite regularly. In addition, there was enough supplementary material in the form of pages on concepts and examples, practice exercises, and video content created by students from previous iterations of the class to better explain concepts and aspects of game-building, improving upon the lecture material.

Concepts and Examples

Concepts_and_examples

Practice Exercises

Practice_exercises

Student-created Videos Explaining Concepts

Student_created_videos

Overall, I had a great learning experience. I completed Part 1 with a 100 per cent score even though I had a minor hiccup while building the game Pong, which was the most satisfying of all the projects in Part 1. I would review Part 2 when I’m done with that in August this year. I’d easily recommend this course to anyone wishing to start off with Python. It is a great place to be introduced to Python, but it shouldn’t be your ONLY resource. I have been taking MIT’s 6.01x introductory Python course side-by-side. I shall review that course as soon as I’m through with it. That course is pedagogically more text-bookish, and indeed they do profess the use of their textbook to complement the course. I’m 4 weeks into that course and finding that enjoyable too – albeit in a different way. I still haven’t lost a point on any of the assignments or finger exercises there, and hope the trend continues:

CourseProgressTillQuiz

PS: In one of the forum threads, Joe posted a list of resources that could be referred to in addition to the class.

Additional_Resources

Python Books:

Another List of Books:

  • http://pythonbooks.revolunet.com/  – about 50 books –  Another good list of free python books that is kept up to date, and I believe are all free or open-source: (I won’t repeat all the books on the list here, just go check it out! Some are also on the list above, but not all)


Further Online Learning:

Solution to [Viral] Math Puzzle for Vietnamese Eight-Year-Olds (Using R)

There was this math problem that went viral recently –  it was a Singapore Math Olympiad problem meant for 14-year olds which surprisingly many adults couldn’t solve. A friend sent me a link to that problem and I solved it with pen and paper in about 10 minutes, leaving me feeling hardly challenged. I guess really-tough questions aren’t the ones that actually go viral. If anything, a math problem going viral means it caters to an average IQ, something like a 100 – which then left me wondering whatever my IQ was! I had taken many online IQ tests when I was pursuing my engineering degree and my scores ranged between 135 and 145. But they weren’t tests one could really feel great about, mainly because everyone I knew who took them, scored 110+. I never took a Mensa test in the past, so I’m not sure whether I’d have made the cut. Anyway, I decided to check Quora to see if the nerds had found anything remotely mimicking a Mensa type IQ test. So I checked out this one and got a 130. It seems to be the least I’ve ever got on an IQ test, so without giving you any rationale to why I feel this might be closer to accurately measuring your IQ, I say it’s probably worth a shot.

iq_test_score


A week back, there was yet another math puzzle that had gone viral, meant for Vietnamese eight-year-olds, a problem that had stumped parents and teachers. You need to fill in the empty boxes below with the digits from 1 to 9 so that the equation makes sense, following the order of operations – multiply first, then division, addition and subtraction last. Apparently, this problem was for third graders in the town of Bao Loc in the Vietnamese Highlands.

I didn’t solve this one with pen and paper, and instead wrote an R program. It’s clearly a problem with a fixed number of variables (nine) associated with standard math operators, meaning there would be 9! (362880) permutations – which makes you think there’s got to be more than one solution. It became obvious I had to write some code.

I wrote a function appropriately named baoloc() to list out the solutions to this problem. The code is self explanatory. I got 128 unique solutions, which means if the students had to solve this problem with pencil on paper, they could get one of 128 possible answers, which makes the job of the examiner arduous and boring!

## The problem could be written as u + 13v/w + x + 12y - z - 11 + pq/r -10 = 66
## which reduces to u + 13v/w + x + 12y - z + pq/r = 87
## This problem was solved on [1] "Wed May 27 17:46:52 2015"
baoloc <- function()
{
packages <- rownames(installed.packages())
if("combinat" %in% packages) library("combinat") else install.packages("combinat")
numbers <- 1:9
permutations <- permn(numbers) ## list of all permutations of vector input
solutions <- numeric(9)
for(i in 1:length(permutations))
{
solution <- permutations[[i]]
if(solution[1] + 13*(solution[2]/solution[3]) + solution[4] + 12*solution[5] - solution[6] + (solution[7]*solution[8] / solution[9]) == 87)
{
solutions <- rbind(solutions, solution)
}
}
print("The number of solutions are:")
print(nrow(solutions)-1)
return(solutions[2:nrow(solutions),])
}
view raw baoloc.R hosted with ❤ by GitHub

The above code produces the following solutions:
[1] "The number of solutions are:"
[1] 128
[,1] [,2] [,3] [,4] [,5] [,6] [,7] [,8] [,9]
solution 9 1 2 5 6 7 3 4 8
solution 7 9 6 1 5 2 3 4 8
solution 1 9 6 7 5 2 3 4 8
solution 1 5 2 3 4 8 7 9 6
solution 1 5 2 3 4 8 9 7 6
solution 5 1 2 9 6 7 3 4 8
solution 5 1 2 9 6 7 4 3 8
solution 1 5 2 8 4 7 3 9 6
solution 1 5 2 8 4 7 9 3 6
solution 1 9 6 7 5 2 4 3 8
solution 7 9 6 1 5 2 4 3 8
solution 9 1 2 5 6 7 4 3 8
solution 1 2 6 4 7 8 5 3 9
solution 1 2 6 4 7 8 3 5 9
solution 1 4 8 2 7 9 3 5 6
solution 1 4 8 2 7 9 5 3 6
solution 7 1 4 9 6 5 2 3 8
solution 9 1 4 7 6 5 2 3 8
solution 5 4 1 9 2 7 8 3 6
solution 5 4 1 9 2 7 3 8 6
solution 9 4 1 5 2 7 8 3 6
solution 9 4 1 5 2 7 3 8 6
solution 4 9 6 1 5 8 3 7 2
solution 4 9 6 1 5 8 7 3 2
solution 8 6 4 7 5 9 1 3 2
solution 7 6 4 8 5 9 1 3 2
solution 9 4 8 5 6 7 1 3 2
solution 5 4 8 9 6 7 1 3 2
solution 1 9 6 4 5 8 7 3 2
solution 1 9 6 4 5 8 3 7 2
solution 9 1 4 7 6 5 3 2 8
solution 7 1 4 9 6 5 3 2 8
solution 1 3 9 4 7 8 2 5 6
solution 1 3 4 7 6 5 2 9 8
solution 1 3 4 7 6 5 9 2 8
solution 1 3 9 4 7 8 5 2 6
solution 1 5 3 9 4 2 7 8 6
solution 1 5 3 9 4 2 8 7 6
solution 1 3 2 9 5 6 7 4 8
solution 1 3 2 9 5 6 4 7 8
solution 1 3 6 2 7 9 5 4 8
solution 1 3 6 2 7 9 4 5 8
solution 1 3 2 4 5 8 7 9 6
solution 1 3 2 4 5 8 9 7 6
solution 6 3 1 9 2 5 8 7 4
solution 6 3 1 9 2 5 7 8 4
solution 9 3 1 6 2 5 8 7 4
solution 9 3 1 6 2 5 7 8 4
solution 7 3 1 5 2 6 8 9 4
solution 7 3 1 5 2 6 9 8 4
solution 5 3 1 7 2 6 9 8 4
solution 5 3 1 7 2 6 8 9 4
solution 9 5 3 1 4 2 7 8 6
solution 9 5 3 1 4 2 8 7 6
solution 3 1 4 2 7 9 6 5 8
solution 3 1 4 2 7 9 5 6 8
solution 7 3 4 1 6 5 9 2 8
solution 7 3 4 1 6 5 2 9 8
solution 3 6 4 9 5 8 1 7 2
solution 3 6 4 9 5 8 7 1 2
solution 5 4 8 9 6 7 3 1 2
solution 9 4 8 5 6 7 3 1 2
solution 7 6 4 8 5 9 3 1 2
solution 8 6 4 7 5 9 3 1 2
solution 9 6 4 3 5 8 1 7 2
solution 9 6 4 3 5 8 7 1 2
solution 4 3 9 1 7 8 5 2 6
solution 4 3 9 1 7 8 2 5 6
solution 4 3 2 1 5 8 9 7 6
solution 4 3 2 1 5 8 7 9 6
solution 3 2 4 8 5 1 7 9 6
solution 3 2 4 8 5 1 9 7 6
solution 5 9 3 6 2 1 8 7 4
solution 5 9 3 6 2 1 7 8 4
solution 3 5 2 1 4 8 9 7 6
solution 3 5 2 1 4 8 7 9 6
solution 6 9 3 5 2 1 7 8 4
solution 6 9 3 5 2 1 8 7 4
solution 3 9 6 2 5 1 7 4 8
solution 3 9 6 2 5 1 4 7 8
solution 3 2 8 6 5 1 7 9 4
solution 3 2 8 6 5 1 9 7 4
solution 7 3 2 8 5 9 6 1 4
solution 8 3 2 7 5 9 6 1 4
solution 8 3 2 7 5 9 1 6 4
solution 7 3 2 8 5 9 1 6 4
solution 3 2 1 5 4 7 8 9 6
solution 3 2 1 5 4 7 9 8 6
solution 3 9 2 8 1 5 7 6 4
solution 9 3 2 1 5 6 7 4 8
solution 3 9 2 8 1 5 6 7 4
solution 9 3 2 1 5 6 4 7 8
solution 2 3 6 1 7 9 4 5 8
solution 2 3 6 1 7 9 5 4 8
solution 8 9 2 3 1 5 6 7 4
solution 8 9 2 3 1 5 7 6 4
solution 2 9 6 3 5 1 4 7 8
solution 2 9 6 3 5 1 7 4 8
solution 6 2 8 3 5 1 9 7 4
solution 6 2 8 3 5 1 7 9 4
solution 7 2 8 9 6 5 3 1 4
solution 9 2 8 7 6 5 3 1 4
solution 8 7 2 5 3 9 6 1 4
solution 8 7 2 5 3 9 1 6 4
solution 5 7 2 8 3 9 1 6 4
solution 5 7 2 8 3 9 6 1 4
solution 8 2 4 3 5 1 9 7 6
solution 8 2 4 3 5 1 7 9 6
solution 8 5 2 7 4 9 3 1 6
solution 7 5 2 8 4 9 3 1 6
solution 4 2 6 1 7 8 3 5 9
solution 4 2 6 1 7 8 5 3 9
solution 7 5 2 8 4 9 1 3 6
solution 8 5 2 7 4 9 1 3 6
solution 2 4 8 1 7 9 5 3 6
solution 2 8 6 9 4 1 5 7 3
solution 2 8 6 9 4 1 7 5 3
solution 9 8 6 2 4 1 7 5 3
solution 9 8 6 2 4 1 5 7 3
solution 2 4 8 1 7 9 3 5 6
solution 2 1 4 3 7 9 5 6 8
solution 2 1 4 3 7 9 6 5 8
solution 8 5 2 1 4 7 9 3 6
solution 8 5 2 1 4 7 3 9 6
solution 5 2 1 3 4 7 9 8 6
solution 5 2 1 3 4 7 8 9 6
solution 9 2 8 7 6 5 1 3 4
solution 7 2 8 9 6 5 1 3 4

How to become a programmer, or the art of Googling well

This should serve as encouragement to all and sundry. Stop wasting time getting intimidated and learn to code like a pro.

Featured Image: http://xkcd.com/979/

okepi's avatarokepi

*Note: Please read all italicized technical words as if they were in a foreign language.

The fall semester of my senior year, I was having some serious self-confidence issues. I had slowly come to realize that I did not, in fact, want to become a researcher. Statistics pained me, and the seemingly endless and fruitless nature of research bored me. I was someone who was driven by results – tangible products with deadlines that, upon completion, had a binary state: success, or failure. Going into my senior year, this revelation was followed by another. All of my skills thus far had been cultivated for research. If I wasn’t going into research, I had… nothing.

At a liberal arts college, being a computer science major does not mean you are a “hacker”. It can mean something as simple as, you were shopping around different departments, saw a command line for the…

View original post 1,398 more words

Excel using R

Very often we find ourselves caught up with really mundane tasks involving voluminous excel data — in business and yes, even in research! The story keeps repeating everywhere. I’ll talk about how to automate some mechanical and brain-dead spreadsheet operations using R. This post will cover the basics of reading and writing operations on Excel data. There are 2 packages worth installing, that I’ve taken a liking to for this purpose. xlsx and XLConnect.

install.packages("xlsx","XLConnect")

Let’s say you have huge volumes of spreadsheet data, of a survey conducted in a city several times during the year (like every month or so). What if you were interested in only some of the details from that survey, and you wanted to extract those details for each time the survey was conducted that year, and summarize the whole thing in yet another spreadsheet. You don’t want to be repeatedly copying and pasting and wasting several man-hours doing so, especially if you had hundreds of surveys to scavenge from. Instead, a simple R script could complete the same task in minutes.

I’ll talk about an example scenario and walk you through the R code. I had data coming from a survey conducted every month of the year for the district of Agra, India — home to the Taj Mahal. Since they were the same survey conducted every month, the excel files were identical in format. Each file contained different data, but of same parameters being tested each month – so data in specific cells, say, E11:V11 were instances of the same metric common to each file. I wanted to stack data from these particular cells from each file onto a fresh excel workbook. I could have copy-pasted the whole thing and done the job manually, but I wasn’t just looking at data from one district, viz., Agra, but hundreds of other districts. This was obviously a task that badly needed automating.

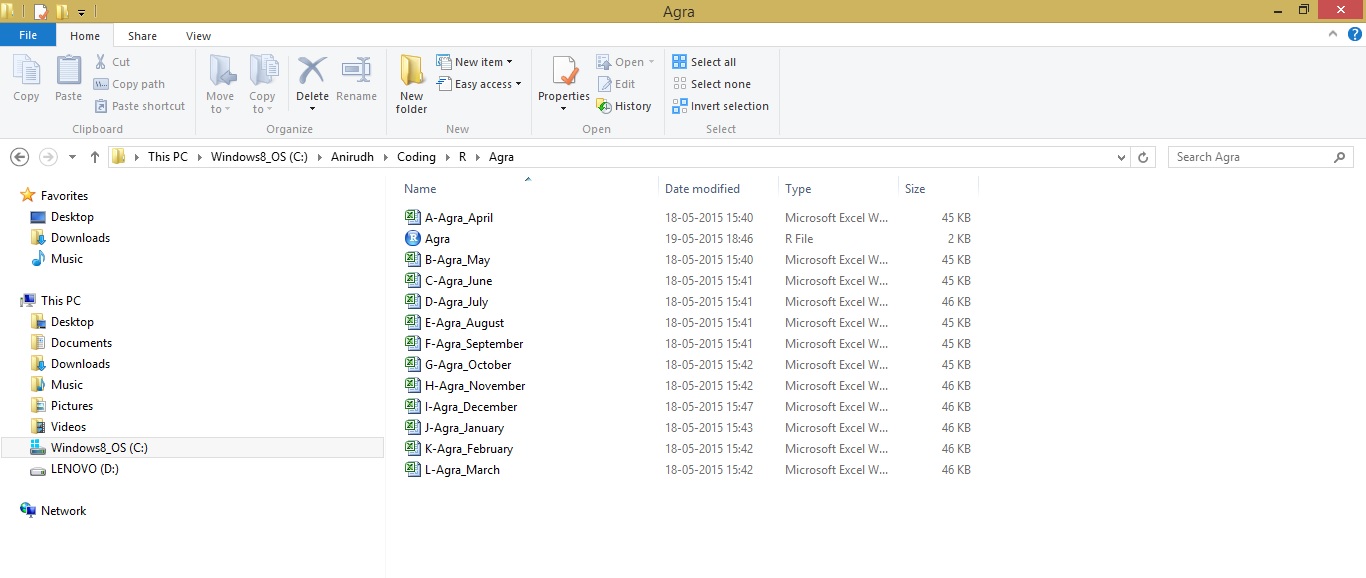
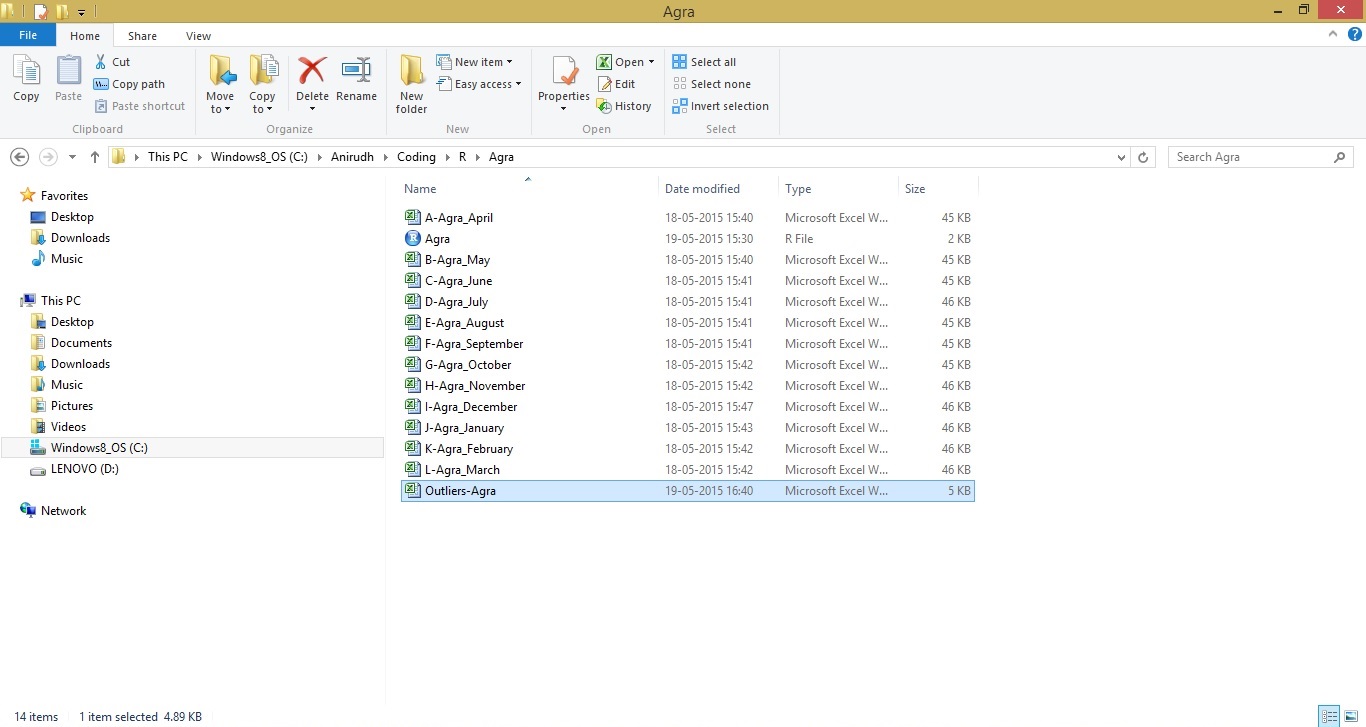
So, for Agra, I had 12 spreadsheets corresponding to surveys for each month of the year. The R file (Agra) that you can see along with the excel files, is the script for creating the final spreadsheet that accomplished the earlier-mentioned objective.

Agra Directory

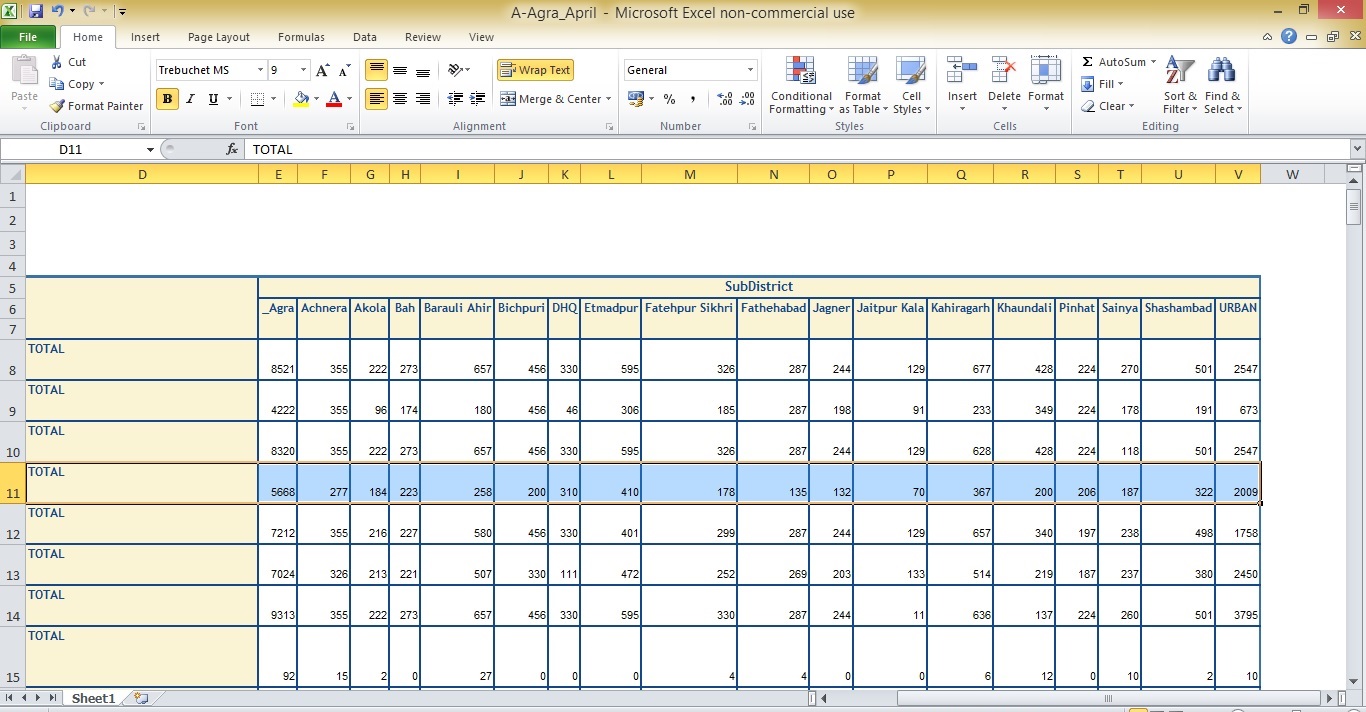
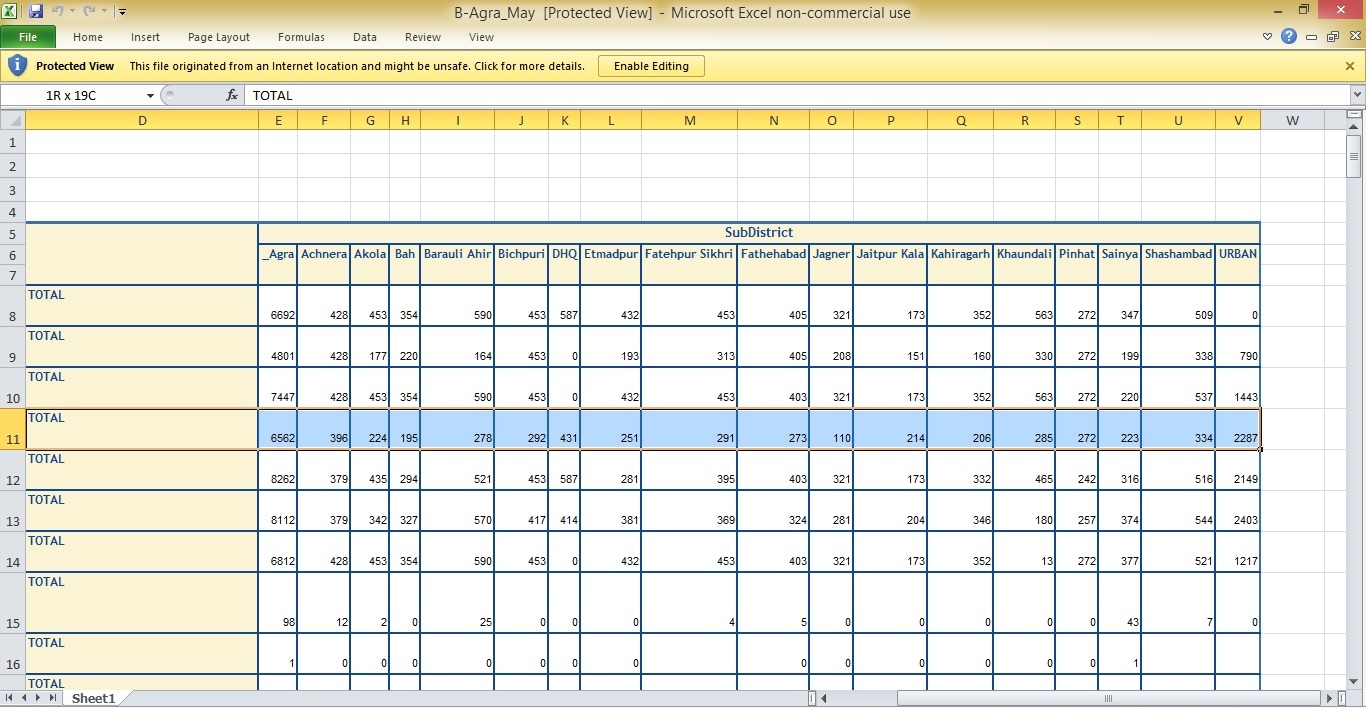
I wanted data taken from the cells E11:V11 from each of the above spreadsheets. For example, here’s how it looks for the April and May spreadsheets (highlighted portion)

A-Agra_April

B-Agra_May

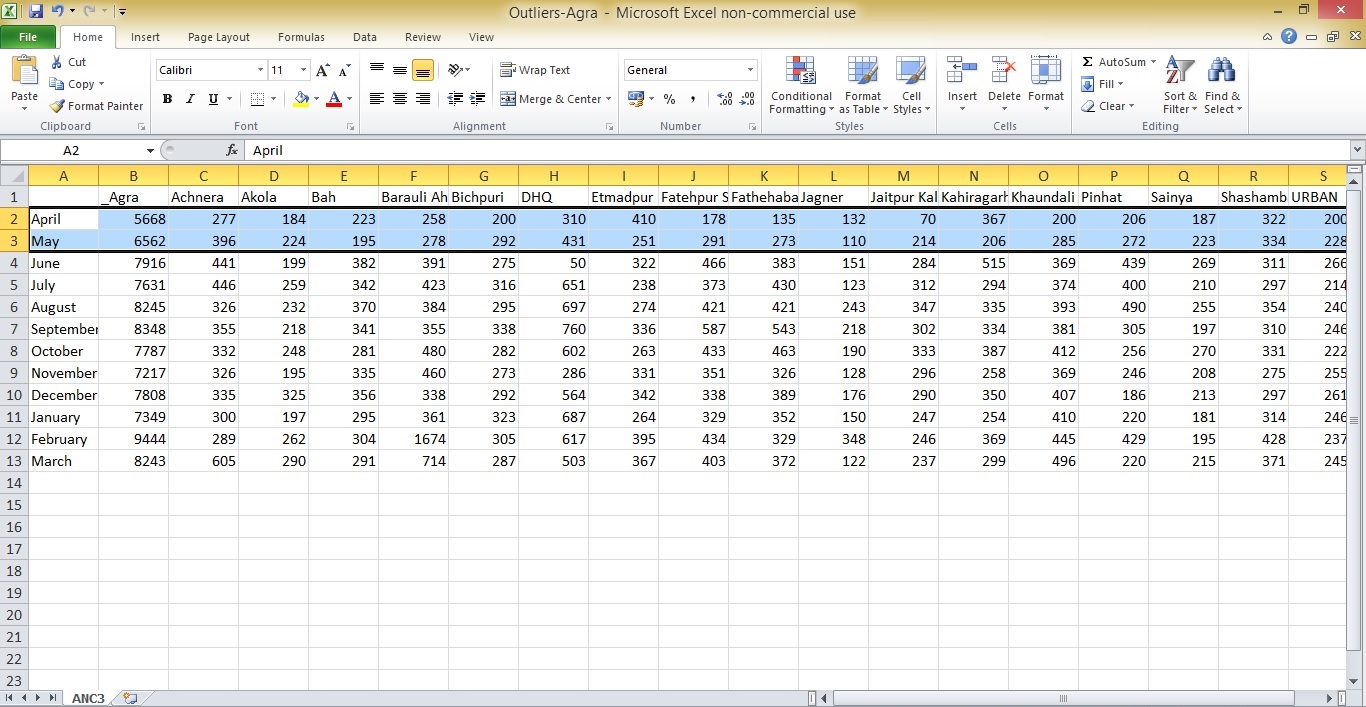
I had to write R code to get the data from each of the spreadsheets to be neatly stacked in a fresh workbook named Outliers-Agra, and give appropriate row names, column names, and worksheet name, as in the screenshot below.

Agra-Outliers.xls

How was this done using R?

First, the necessary libraries had to be loaded into R, the ones talked about at the start of this post.

library("xlsx") 
library("XLConnect")  

Next, I had to change the working directory to where the survey data was kept, in this case, a folder aptly named Agra. The files in the directory were stored in a vector named files. Since the main R-file where I was writing the script Agra.R, was part of that directory, it also was part of the vector files. The vector files was created to later read the spreadsheets iteratively using a for-loop, so Agra.R had to be deleted from it. This was done using the which() function to locate the position of the R-file, craftily using subsetting rules to remove it from the vector.

setwd("C:/Anirudh/Coding/R/Agra") ## CHANGE WORKING DIRECTORY as required
files <- list.files() ## vector containing the file names in that directory
files <- files[-which(files == "Agra.R")] ## Removes R-file (in this case, Agra.R) from the vector of files

An empty matrix, temp, was created to be exactly the size of the data to be read from all the excel files in the directory. The data from each file was then iteratively stored to fill temp. The read.xlsx() function is a function from the xlsx library. The arguments are mostly self-explanatory. files[i] subsets the ith instance in files. header is set FALSE to indicate that the top row of the excel file did not consist of variables.

temp <- matrix(nrow = length(files), ncol = 18) ## matrix, 18 columns as in 5:22, rows = no.of xls files
for(i in seq_along(files[1:length(files)]))
{
  dat <- read.xlsx(files[i], sheetIndex = 1, rowIndex = 11, colIndex = 5:22, header = FALSE)
  mat <- as.matrix(dat) ## reading data from 11th row of xlsx file into a matrix of row size 1
  temp[i,] <- mat ## storing data from above matrix into matrix temp
}

The contents of temp (a matrix object) were then stored in a data frame object before being written to a fresh excel file (this is necessary). For writing operations in excel, I used functions from the XLConnect library. The workbook had to be loaded using loadWorkbook() with the create argument set to TRUE to indicate that a fresh excel file was being created. If I had to write to an already existing file, the argument would have been set FALSE . I created a worksheet and named it ANC3 (that had got something to do with the data). startRow and startCol are set to the location where we want the data to begin from.

df <- as.data.frame(temp) ## storing contents of temp matrix as data frame
wb <- loadWorkbook("C:/Anirudh/Coding/R/Agra/Outliers-Agra.xlsx", create = TRUE) # new workbook
createSheet(wb, name = "ANC3") ## create worksheet / tab with name "ANC3"
writeWorksheet(wb, df, sheet = "ANC3", startRow = 2, startCol = 2, header = FALSE)

Next, the data in the new excel file, Outliers-Agra.xlsx was given appropriate column names (colnames) and row names (months).

colnames <- read.xlsx(files[i],sheetIndex = 1, rowIndex = 6, colIndex = 5:22, header = FALSE)
colnames <- as.data.frame(as.matrix(colnames))
months <- as.data.frame(matrix(c("April", "May", "June", "July", "August", "September","October", "November","December", "January", "February", "March")))
writeWorksheet(wb, colnames, sheet = "ANC3", startRow = 1, startCol = 2, header = FALSE)
writeWorksheet(wb, months, sheet = "ANC3", startRow = 2, startCol = 1, header = FALSE)

Lastly, the workbook needed to be saved.

saveWorkbook(wb)

After executing the R script, the new workbook Outliers-Agra is added to the parent directory.

Agra Directory with Agra.R and Outliers-Agra

So this is how some basic Excel work can be managed using R. Since these were only 12 files, writing all this code to perform simple copy and paste functions might seem like an awful lot to go through. But the data in this example was for one Indian district  (Agra) — and if you had to do the same thing thousands of times covering hundreds of districts (directories), you’d thank this gem of free software known as R, for what it can accomplish.

Featured Image: https://xkcd.com/1445/

Code for my First Text-Based Game

I started learning Python from Learn Python the Hard Way, 10 days ago. The last scripting language I learnt was C++, but it was ages ago – and never took to it with as much interest as I am taking on Python. I learnt C++ to pass an undergraduate course in 2008, and that’s all I really wanted from it back then.

There are 52 exercises in the book, and I have finished the 36th exercise today. It required me to write code for a simple text-based game, the likes of which were people played by computer nerds in the 80’s when the GUIs weren’t as advanced as they are today. Sometimes nerds from our generation might also want to get a kick out of these text-based games, as evidenced by the following:

Here’s the python code for this text-based game you might want to try out. You can simply copy the code below into a text file, naming it something like game.py and save it to your home directory or wherever you wish to and run game.py from. Then from Terminal (CMD for Windows), type in python game.py. Of course, you need to have Python installed. If you want to learn how to create a text based game of your own, the best way would be to play such a game, simultaneously glancing at its code, understanding how the game was programmed to function. I haven’t over-complicated this one so that newbs like me could work out the map easily – and maybe add their own branches and make the game lot more interesting.

from sys import exit

def lion():
    print "You had to choose some direction and you chose West. You have been walking for miles.... and you're thirsty, and dehydrated."
    print "... you have just begun to feel you're walking into eternity when you see a T-junction. But just then you hear a ROAR!!!"
    print "You turn back to see a giant lion, miles away, running after you at great speed. You just have time to react. What now?"
    
    do_what = raw_input("> ")
    
    if "left" in do_what or "south" in do_what:
        print "Unfortunately for you, the lion catches up and rips you to shreds. You feel intense pain, yet you can't die. This is hell." 
        dead()
    elif "right" in do_what or "north" in do_what:
        print "You find a portal to another dimension. Could this be a trap? Or should you take that chance? What do you do?"
        do_what = raw_input("> ")
        if "portal" in do_what:
            cthulhu()
        else:
            dead()
    else:
        dead()

def princess():
    print "You have been walking for miles... and this is geting frustrating. Will this road ever end?"
    print "A dagger falls from the skies abvoe. What do you do?"
    do_what = raw_input("> ")
    if "dagger" in do_what or "pick" in do_what:
        print "lo and behold! A beautiful princess stands before you."
        print "A diamond on the hilt of your dagger turns the color of her eyes. This is a clue."
        what_color = raw_input("Do you see the color or blood?\n> ")
        print "... are you sexually attracted to her?"
        sexually_attracted = raw_input("> ")
        print "You'll have to make a choice. You can either go kiss in a warm embrace or kill her with your dagger. Which will it be?"
        your_choice = raw_input("> ")
        if "yes" in what_color or "blood" in what_color:
            if "kill" in your_choice:
                win()
            else:
                dead()
        elif "yes" in sexually_attracted:
            if "kiss" in your_choice:
                print "You have been betrayed by your lecherous lust. This goddess of desire turns into a dragon and burns you to dust."
                dead()
            else:
                win()
                
        elif "no" in sexually_attracted:
                if "kill" in your_choice:
                    print "What a muderous and sinful thing you did."
                    dead()
                else:
                    win()
        else:
            dead()
    else:
        print "You should have picked up the dagger. You never know what might be coming..."
        print "...but what do we have here!? A beautiful maiden! She looks like royalty. In fact she is a princess!"
        print "... are you sexually attracted to her?"   
        sexually_attracted = raw_input("> ")
        if "yes" in sexually_attracted:
            print "You have been betrayed by your lecherous lust. This goddess of desire turns into a dragon and burns you to dust."
            dead()
        else:
            print "The princess gives you a magic potion that can grant you any boon."
            print "You ask for all the happiness and riches of the world"
            win()                        


def prince():
    print "You have been walking for miles... and this is geting frustrating. Will this road ever end?"
    print "A dagger falls from the skies abvoe. What do you do?"
    do_what = raw_input("> ")
    if "dagger" in do_what or "pick" in do_what:
        print "lo and behold! A handsome prince stands before you."
        print "A diamond on the hilt of your dagger turns the color of his hair. This is a clue."
        what_color = raw_input("Do you see the color or blood?\n> ")
        print "... are you sexually attracted to him?"
        sexually_attracted = raw_input("> ")
        print "You'll have to make a choice. You can either go kiss in a warm embrace or kill him with your dagger. Which will it be?"
        your_choice = raw_input("> ")
        if "yes" in what_color or "blood" in what_color:
            if "kill" in your_choice:
                win()
            else:
                dead()
        elif "yes" in sexually_attracted:
            if "kiss" in your_choice:
                print "You have been betrayed by your lecherous lust. This god of desire turns into a dragon and burns you to dust."
                dead()
            else:
                win()
                
        elif "no" in sexually_attracted:
                if "kill" in your_choice:
                    print "What a muderous and sinful thing you did."
                    dead()
                else:
                    win()
        else:
            dead()
    else:
        print "You should have picked up the dagger. You never know what might be coming..."
        print "...but what do we have here!? A handsome prince!"
        print "... are you sexually attracted to him?"   
        sexually_attracted = raw_input("> ")
        if "yes" in sexually_attracted:
            print "You have been betrayed by your lecherous lust. This god of desire turns into a dragon and burns you to dust."
            dead()
        else:
            print "The prince gives you a magic potion that can grant you any boon."
            print "You ask for all the happiness and riches of the world"
            win()                        


def cthulhu():
    print "You walk for miles into what seems like an endless abyss. And then he presents himself. The evil Cthulhu."
    print "He, it, or whatever - stares at you and you go insane."
    print "Do you flee for your life or eat your head?"
    
    next = raw_input("> ")
    
    if "flee" in next:
        start()
    elif "head" in next:
        cthulhu()
        
def win():
    print "You made an excellent choice. You win. You are magically transported to your time, your world."
    print "Exit? (y / n)"
    exit = raw_input("> ")
    if "y" in exit or "Y" in exit:
        exit(0)
    else:
        start()        


def dead():
    print "Wrong move friend. You shall be lost forever into the infinite abyss of the tree of the undead."
    exit(0)

def start():
    print "You are walking through an enchanted forest with gigantic trees as tall as mountains and as thick as large lakes."
    print "You got here magically teleported into a distant planet in a distant galaxy in the future."
    print "You see one such tree with a cave-like structure at its base. What do you do?"
    
    do_what = raw_input("> ")
    
    while True:
        if "cave" in do_what or "cave-like" in do_what or "enter" in do_what:
            print "You enter  the dark hollow of an ancient tree that has had earthlings like you in the past."
            print "This tree is called the tree of the undying, where death won't touch you."
            print "On the other hand, pain can - if you don't make the right moves. And then you have to live with the pain for eternity."
            print "You are suddenly sucked into a vortex, finding yourself at crossroads of sorts." 
            print "From here, you can go north, south, east or west."
        
            while True: 
                now_what = raw_input("> ")
                if "north" in now_what:
                    cthulhu()
                elif "south" in now_what:
                    prince()
                elif "east" in now_what:
                    princess()
                elif "west" in now_what:
                    lion()
                else:
                    print "I got no idea what you're saying. Is it that hard picking a cardinal direction?" 
        else:
            print "I got no idea what you're saying. You have no choice but to enter the cave. Now let's start over"
            start()
            

start()        

featured image source: http://xkcd.com/91/

One-Month-Old Blog

UPDATE: While I’m already half way through the much recommended book by Zed A. Shaw – Learn Python The Hard Way, I’m still doing my research on other great resources to help me get started with Python. This page listing 10 Python blogs worth following, in particular emphasizes Mouse vs python to be the most useful. Starting the 10th of June, I’ll be engaged on a 9-week-long MOOC on Computer Science using Python, offered by MIT.

It’s been 2 months since I got started with R, and although my progress seems fast to me, it appears so mainly because R comes with insanely helpful packages that reduce large chunks of code into simple functions. Not only that, data visualization and graphics generated in R are beautiful and elegant. For example, the following code generates a Mandelbrot set created through the first 50 iterations of equation z = z2 + c plotted for different complex constants c

library(caTools)         # external package providing write.gif function
jet.colors <- colorRampPalette(c("#00007F", "blue", "#007FFF", "cyan", "#7FFF7F",
                                 "yellow", "#FF7F00", "red", "#7F0000"))
m <- 1000                # define size
C <- complex( real=rep(seq(-1.8,0.6, length.out=m), each=m ),
              imag=rep(seq(-1.2,1.2, length.out=m), m ) )
C <- matrix(C,m,m)       # reshape as square matrix of complex numbers
Z <- 0                   # initialize Z to zero
X <- array(0, c(m,m,50)) # initialize output 3D array
for (k in 1:50) {        # loop with 50 iterations
  Z <- Z^2+C             # the central difference equation
  X[,,k] <- exp(-abs(Z)) # capture results
}
write.gif(X, "Mandelbrot.gif", col=jet.colors, delay=800)

Mandelbrot

This is just an illustration of the power of a dozen or so lines of R code. Just as there are a ridiculous many packages in R, there are countless modules packed into many thousands of packages in Python to make life simpler, so I wasn’t surprised to find a module called antigravity, that can be imported in Python like this:

 import antigravity  

and voila, you are redirected to this telling XKCD tale of Cueball performing gravity-defying stunts with Python.

source: http://www.xkcd.com/353/

Upgrading R / Installing R-3.2.0 on Ubuntu

Till recently, I was using R-3.1.1 on Windows OS. Then on April 16, 2015 (10 days ago), they released R-3.2.0. Upgrading it on Windows was easy peasy, not like the headache Ubuntu gave me.

I recently got a Dell Vostro 14 3000 series laptop with Ubuntu 12.04 installed. I haven’t yet upgraded to Ubuntu 14.04 because the graphics drivers for this computer aren’t available for that version. Besides, I’m not much of a gamer. If I were, I wouldn’t care for Ubuntu!

Anyway, I tried installing by typing the following on Terminal:

 sudo apt-get update  
 sudo apt-get install r-base r-base-dev  

R did get installed, but not the latest version. A much older version R-2.14.1. I later found out after quite a lot of time spent on StackExchange, that I had to choose a CRAN mirror that was geographically close to my computer, which would then act as a “software source” for the latest version of R. Now that explained why the above sudo commands weren’t getting me the desired version of software. It was because the the Ubuntu / Canonical software repositories only had an older R version. Also, the distribution line had to match the codename of my Ubuntu version (12.04 LTS).

 codename=$(lsb_release -c -s)  
 echo "deb http://ftp.iitm.ac.in/cran/bin/linux/ubuntu $codename/" | sudo tee -a /etc/apt/sources.list > /dev/null  

Note that instead of http://ftp.iitm.ac.in/cran one must replace it with the geographically closest CRAN mirror. Also, the Ubuntu archives on CRAN are signed with the key of Michael Rutter <marutter@gmail> with key ID E084DAB9. So we type in the following:

 sudo apt-key adv --keyserver keyserver.ubuntu.com --recv-keys E084DAB9  
 sudo add-apt-repository ppa:marutter/rdev

Followed by what we would normally have done:

 sudo apt-get update  
 sudo apt-get upgrade  
 sudo apt-get install r-base r-base-dev  

This did the job for me, and I had R-3.2.0 installed successfully on my Ubuntu system. Compare this to Windows, where all you have to do is type in 3 lines (in R, and not Shell):

install.packages("installr")  
library(installr)  
updateR()

And to think I left Windows for Linux! I am a Linux newb, and God only knows why I wanted to try out Linux, but on giving it some thought, I think I know why


source: https://xkcd.com/456/ and http://xkcd.com/149/

Visualizing Macroeconomic Data using Choropleths in R

Choropleths are thematic maps shaded or patterned in proportion to the measurement of the statistical variable being displayed on the map, such as population density or per-capita-income.

example choropleth

This post is about creating quick choropleth maps in R, with macroeconomic data across geographies.

As a sample exercise, I decided to get data on what percentage of their aggregate disbursements, do states in India spend on development expenditure. I got the data from the Reserve Bank of India’s website. I had to clean the data a little for easy handling in R. Here’s the cleaned data.

I used the choroplethr package designed by Ari Lamstein and Brian P Johnson to animate the data on the map of India. Here’s my code followed by output maps.

## load the requisite libraries into R
library("xlsx")
library("choroplethr")
library("choroplethrAdmin1")
library("ggplot2")
indianregions <- get_admin1_regions("india")
## gets dataframe of 2 columns with name of country ("india") throughout column 1
## and name of regions in 2nd column
nrow(indianregions)
## counts the number of regions under country "india"
setwd("C:/Anirudh/Coding/R/Practice/Practice Iteration 2")
df_dev_indicators <- read.xlsx("statewise_development_indicators.xls", sheetIndex = 1, colIndex = 2:5, rowIndex = 2:31, header = FALSE)
## reads excel data into an R dataframe
df_dev_indicators_2012 <- df_dev_indicators[c(1,2)]
df_dev_indicators_2013 <- df_dev_indicators[c(1,3)]
df_dev_indicators_2014 <- df_dev_indicators[c(1,4)]
## create 3 separate dataframes from the parent dataframe so as to have 2 columns,
## column 1 for region and column 2 for column 2 for value metric
names(df_dev_indicators_2012) <- c("region","value")
names(df_dev_indicators_2013) <- c("region","value")
names(df_dev_indicators_2014) <- c("region","value")
## assigning column names [required as per choroplethr function]
admin1_choropleth("india", df_dev_indicators_2012, title = "% Expenditure on Development in 2012", legend = "", buckets = 9, zoom = NULL)
## prints the choropleth map for 2012 indicators
southern_states <- c("state of karnataka","state of andhra pradesh", "state of kerala", "state of tamil nadu", "state of goa")
## stores regions that are to be printed as a bucket map
admin1_choropleth("india", df_dev_indicators_2012, title = "% Expenditure on Development in Southern States in 2012", legend = "", buckets = 9, zoom = southern_states)
## zooms into the buckets specified earlier
## --- CONTINUOUS SCALE ---
admin1_choropleth("india", df_dev_indicators_2012, title = "% Expenditure on Development in 2012", legend = "", buckets = 1, zoom = NULL)
admin1_choropleth("india", df_dev_indicators_2013, title = "% Expenditure on Development in 2013", legend = "", buckets = 1, zoom = NULL)
admin1_choropleth("india", df_dev_indicators_2014, title = "% Expenditure on Development in 2014", legend = "", buckets = 1, zoom = NULL)
view raw choroplethr.R hosted with ❤ by GitHub

…and as expected, the lines of code above print out the desired map

Expenditure on Development in Southern States (2012)

In the examples above I set the buckets attribute equal to 9. That set the data in discrete scales. Had I set buckets = 1 instead, we would have got a continuous scale of data.

Expenditure on Development (2012)_continuous

The same for the last 2 fiscal years:

Development Expenditures in the Last 2 Years

For the US, there are amazing packages for county level and ZIP code level detail of data visualization.

Here’s more on the choroplethr package for R and creating your own maps.

Getting Started

I have been searching for good MOOCs to get me started with R and Python programming languages. I’ve already begun the Johns Hopkins University Data Science Specialization on Coursera. It consists of 9 courses (including Data Scientist’s Toolbox, R programming, Getting and Cleaning Data, Exploratory Data Analysis, Reproducible Research, Statistical Inference, Regression Models, Practical Machine Learning and Developing Data Products), ending with a 7-week Capstone Project that I’m MOST excited about. I want to get there fast.

The Capstone would consist of :
  • Building a predictive data model for analyzing large textual data sets
  • Cleaning real-world data and perform complex regressions
  • Creating visualizations to communicate data analyses
  • Building a final data product in collaboration with SwiftKey, award-winning developer of leading keyboard apps for smartphones

I started with the R programming course where I found the programming assignments to be moderately difficult. They were good practice and also time-consuming for me since I haven’t yet gotten used to the R syntax, which is supposedly unintuitive. Anyway, I completed the course with distinction (90+ marks) scoring 95 on 100, losing 5 because I hadn’t familiarized myself with Git / GitHub. I did this course for a verified certificate, which cost me $29, and looks like this:

Coursera rprog 2015

I won’t be paying for any of the remaining courses though, but still will get a certificate of accomplishment for each course I pass. I have alredy begun with Getting and Cleaning Data and Data Scientist’s Toolbox.

I checked today, and it seems Andrew Ng’s Machine Learning course has gone open to all and is self-paced. A lot of people have gone on to participate in Kaggle competitions with what they learnt in his course, so I’d like to experience it — even though it’s taught with Octave / MATLAB. My very short term goal is to start participating in these competitions ASAP.

Kaggle Competitions

I will be learning the basics of Git this week and along with that, about reading from MySQL, HDF5, the web and APIs. I intend to start reading Trevor Hastie’s highly recommended book, Introduction to Statistical Learning.

ISL Cover 2

[DOWNLOAD LINK TO THE BOOK]

Meanwhile, I need to get started with Git and GitHub too, and I found a very useful blog by Kevin Markham and his short concise videos are great introductory material.

Incidentally, I was in a dilemma whether to start with Hastie’s material or Andrew Ng’s course first. This is what Kevin had to say

Hastie or Ng

The only reason I have reservations against Andrew Ng’s course is that its instruction isn’t in R or Python. Also, CTO and co-founder of Kaggle, Ben Hamner mentions here how useful R and Python are vis-à-vis Matlab / Octave.

Ben Hamner on Python R Matlab v2