Code for my First Text-Based Game

I started learning Python from Learn Python the Hard Way, 10 days ago. The last scripting language I learnt was C++, but it was ages ago – and never took to it with as much interest as I am taking on Python. I learnt C++ to pass an undergraduate course in 2008, and that’s all I really wanted from it back then.

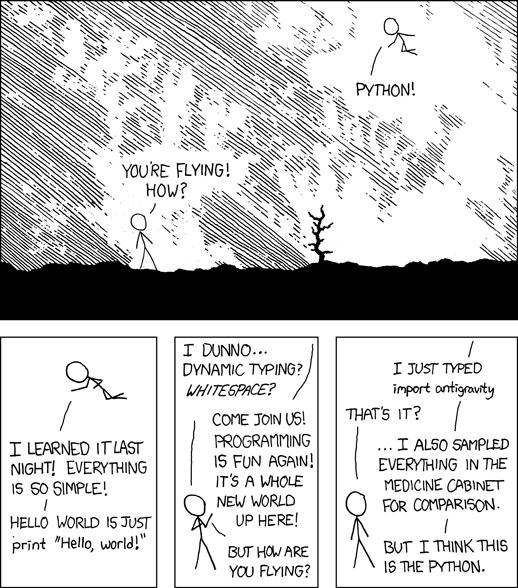
There are 52 exercises in the book, and I have finished the 36th exercise today. It required me to write code for a simple text-based game, the likes of which were people played by computer nerds in the 80’s when the GUIs weren’t as advanced as they are today. Sometimes nerds from our generation might also want to get a kick out of these text-based games, as evidenced by the following:

Here’s the python code for this text-based game you might want to try out. You can simply copy the code below into a text file, naming it something like game.py and save it to your home directory or wherever you wish to and run game.py from. Then from Terminal (CMD for Windows), type in python game.py. Of course, you need to have Python installed. If you want to learn how to create a text based game of your own, the best way would be to play such a game, simultaneously glancing at its code, understanding how the game was programmed to function. I haven’t over-complicated this one so that newbs like me could work out the map easily – and maybe add their own branches and make the game lot more interesting.

from sys import exit

def lion():
    print "You had to choose some direction and you chose West. You have been walking for miles.... and you're thirsty, and dehydrated."
    print "... you have just begun to feel you're walking into eternity when you see a T-junction. But just then you hear a ROAR!!!"
    print "You turn back to see a giant lion, miles away, running after you at great speed. You just have time to react. What now?"
    
    do_what = raw_input("> ")
    
    if "left" in do_what or "south" in do_what:
        print "Unfortunately for you, the lion catches up and rips you to shreds. You feel intense pain, yet you can't die. This is hell." 
        dead()
    elif "right" in do_what or "north" in do_what:
        print "You find a portal to another dimension. Could this be a trap? Or should you take that chance? What do you do?"
        do_what = raw_input("> ")
        if "portal" in do_what:
            cthulhu()
        else:
            dead()
    else:
        dead()

def princess():
    print "You have been walking for miles... and this is geting frustrating. Will this road ever end?"
    print "A dagger falls from the skies abvoe. What do you do?"
    do_what = raw_input("> ")
    if "dagger" in do_what or "pick" in do_what:
        print "lo and behold! A beautiful princess stands before you."
        print "A diamond on the hilt of your dagger turns the color of her eyes. This is a clue."
        what_color = raw_input("Do you see the color or blood?\n> ")
        print "... are you sexually attracted to her?"
        sexually_attracted = raw_input("> ")
        print "You'll have to make a choice. You can either go kiss in a warm embrace or kill her with your dagger. Which will it be?"
        your_choice = raw_input("> ")
        if "yes" in what_color or "blood" in what_color:
            if "kill" in your_choice:
                win()
            else:
                dead()
        elif "yes" in sexually_attracted:
            if "kiss" in your_choice:
                print "You have been betrayed by your lecherous lust. This goddess of desire turns into a dragon and burns you to dust."
                dead()
            else:
                win()
                
        elif "no" in sexually_attracted:
                if "kill" in your_choice:
                    print "What a muderous and sinful thing you did."
                    dead()
                else:
                    win()
        else:
            dead()
    else:
        print "You should have picked up the dagger. You never know what might be coming..."
        print "...but what do we have here!? A beautiful maiden! She looks like royalty. In fact she is a princess!"
        print "... are you sexually attracted to her?"   
        sexually_attracted = raw_input("> ")
        if "yes" in sexually_attracted:
            print "You have been betrayed by your lecherous lust. This goddess of desire turns into a dragon and burns you to dust."
            dead()
        else:
            print "The princess gives you a magic potion that can grant you any boon."
            print "You ask for all the happiness and riches of the world"
            win()                        


def prince():
    print "You have been walking for miles... and this is geting frustrating. Will this road ever end?"
    print "A dagger falls from the skies abvoe. What do you do?"
    do_what = raw_input("> ")
    if "dagger" in do_what or "pick" in do_what:
        print "lo and behold! A handsome prince stands before you."
        print "A diamond on the hilt of your dagger turns the color of his hair. This is a clue."
        what_color = raw_input("Do you see the color or blood?\n> ")
        print "... are you sexually attracted to him?"
        sexually_attracted = raw_input("> ")
        print "You'll have to make a choice. You can either go kiss in a warm embrace or kill him with your dagger. Which will it be?"
        your_choice = raw_input("> ")
        if "yes" in what_color or "blood" in what_color:
            if "kill" in your_choice:
                win()
            else:
                dead()
        elif "yes" in sexually_attracted:
            if "kiss" in your_choice:
                print "You have been betrayed by your lecherous lust. This god of desire turns into a dragon and burns you to dust."
                dead()
            else:
                win()
                
        elif "no" in sexually_attracted:
                if "kill" in your_choice:
                    print "What a muderous and sinful thing you did."
                    dead()
                else:
                    win()
        else:
            dead()
    else:
        print "You should have picked up the dagger. You never know what might be coming..."
        print "...but what do we have here!? A handsome prince!"
        print "... are you sexually attracted to him?"   
        sexually_attracted = raw_input("> ")
        if "yes" in sexually_attracted:
            print "You have been betrayed by your lecherous lust. This god of desire turns into a dragon and burns you to dust."
            dead()
        else:
            print "The prince gives you a magic potion that can grant you any boon."
            print "You ask for all the happiness and riches of the world"
            win()                        


def cthulhu():
    print "You walk for miles into what seems like an endless abyss. And then he presents himself. The evil Cthulhu."
    print "He, it, or whatever - stares at you and you go insane."
    print "Do you flee for your life or eat your head?"
    
    next = raw_input("> ")
    
    if "flee" in next:
        start()
    elif "head" in next:
        cthulhu()
        
def win():
    print "You made an excellent choice. You win. You are magically transported to your time, your world."
    print "Exit? (y / n)"
    exit = raw_input("> ")
    if "y" in exit or "Y" in exit:
        exit(0)
    else:
        start()        


def dead():
    print "Wrong move friend. You shall be lost forever into the infinite abyss of the tree of the undead."
    exit(0)

def start():
    print "You are walking through an enchanted forest with gigantic trees as tall as mountains and as thick as large lakes."
    print "You got here magically teleported into a distant planet in a distant galaxy in the future."
    print "You see one such tree with a cave-like structure at its base. What do you do?"
    
    do_what = raw_input("> ")
    
    while True:
        if "cave" in do_what or "cave-like" in do_what or "enter" in do_what:
            print "You enter  the dark hollow of an ancient tree that has had earthlings like you in the past."
            print "This tree is called the tree of the undying, where death won't touch you."
            print "On the other hand, pain can - if you don't make the right moves. And then you have to live with the pain for eternity."
            print "You are suddenly sucked into a vortex, finding yourself at crossroads of sorts." 
            print "From here, you can go north, south, east or west."
        
            while True: 
                now_what = raw_input("> ")
                if "north" in now_what:
                    cthulhu()
                elif "south" in now_what:
                    prince()
                elif "east" in now_what:
                    princess()
                elif "west" in now_what:
                    lion()
                else:
                    print "I got no idea what you're saying. Is it that hard picking a cardinal direction?" 
        else:
            print "I got no idea what you're saying. You have no choice but to enter the cave. Now let's start over"
            start()
            

start()        

featured image source: http://xkcd.com/91/

One-Month-Old Blog

UPDATE: While I’m already half way through the much recommended book by Zed A. Shaw – Learn Python The Hard Way, I’m still doing my research on other great resources to help me get started with Python. This page listing 10 Python blogs worth following, in particular emphasizes Mouse vs python to be the most useful. Starting the 10th of June, I’ll be engaged on a 9-week-long MOOC on Computer Science using Python, offered by MIT.

It’s been 2 months since I got started with R, and although my progress seems fast to me, it appears so mainly because R comes with insanely helpful packages that reduce large chunks of code into simple functions. Not only that, data visualization and graphics generated in R are beautiful and elegant. For example, the following code generates a Mandelbrot set created through the first 50 iterations of equation z = z2 + c plotted for different complex constants c

library(caTools)         # external package providing write.gif function
jet.colors <- colorRampPalette(c("#00007F", "blue", "#007FFF", "cyan", "#7FFF7F",
                                 "yellow", "#FF7F00", "red", "#7F0000"))
m <- 1000                # define size
C <- complex( real=rep(seq(-1.8,0.6, length.out=m), each=m ),
              imag=rep(seq(-1.2,1.2, length.out=m), m ) )
C <- matrix(C,m,m)       # reshape as square matrix of complex numbers
Z <- 0                   # initialize Z to zero
X <- array(0, c(m,m,50)) # initialize output 3D array
for (k in 1:50) {        # loop with 50 iterations
  Z <- Z^2+C             # the central difference equation
  X[,,k] <- exp(-abs(Z)) # capture results
}
write.gif(X, "Mandelbrot.gif", col=jet.colors, delay=800)

Mandelbrot

This is just an illustration of the power of a dozen or so lines of R code. Just as there are a ridiculous many packages in R, there are countless modules packed into many thousands of packages in Python to make life simpler, so I wasn’t surprised to find a module called antigravity, that can be imported in Python like this:

 import antigravity  

and voila, you are redirected to this telling XKCD tale of Cueball performing gravity-defying stunts with Python.

source: http://www.xkcd.com/353/

Upgrading R / Installing R-3.2.0 on Ubuntu

Till recently, I was using R-3.1.1 on Windows OS. Then on April 16, 2015 (10 days ago), they released R-3.2.0. Upgrading it on Windows was easy peasy, not like the headache Ubuntu gave me.

I recently got a Dell Vostro 14 3000 series laptop with Ubuntu 12.04 installed. I haven’t yet upgraded to Ubuntu 14.04 because the graphics drivers for this computer aren’t available for that version. Besides, I’m not much of a gamer. If I were, I wouldn’t care for Ubuntu!

Anyway, I tried installing by typing the following on Terminal:

 sudo apt-get update  
 sudo apt-get install r-base r-base-dev  

R did get installed, but not the latest version. A much older version R-2.14.1. I later found out after quite a lot of time spent on StackExchange, that I had to choose a CRAN mirror that was geographically close to my computer, which would then act as a “software source” for the latest version of R. Now that explained why the above sudo commands weren’t getting me the desired version of software. It was because the the Ubuntu / Canonical software repositories only had an older R version. Also, the distribution line had to match the codename of my Ubuntu version (12.04 LTS).

 codename=$(lsb_release -c -s)  
 echo "deb http://ftp.iitm.ac.in/cran/bin/linux/ubuntu $codename/" | sudo tee -a /etc/apt/sources.list > /dev/null  

Note that instead of http://ftp.iitm.ac.in/cran one must replace it with the geographically closest CRAN mirror. Also, the Ubuntu archives on CRAN are signed with the key of Michael Rutter <marutter@gmail> with key ID E084DAB9. So we type in the following:

 sudo apt-key adv --keyserver keyserver.ubuntu.com --recv-keys E084DAB9  
 sudo add-apt-repository ppa:marutter/rdev

Followed by what we would normally have done:

 sudo apt-get update  
 sudo apt-get upgrade  
 sudo apt-get install r-base r-base-dev  

This did the job for me, and I had R-3.2.0 installed successfully on my Ubuntu system. Compare this to Windows, where all you have to do is type in 3 lines (in R, and not Shell):

install.packages("installr")  
library(installr)  
updateR()

And to think I left Windows for Linux! I am a Linux newb, and God only knows why I wanted to try out Linux, but on giving it some thought, I think I know why


source: https://xkcd.com/456/ and http://xkcd.com/149/

Visualizing Macroeconomic Data using Choropleths in R

Choropleths are thematic maps shaded or patterned in proportion to the measurement of the statistical variable being displayed on the map, such as population density or per-capita-income.

example choropleth

This post is about creating quick choropleth maps in R, with macroeconomic data across geographies.

As a sample exercise, I decided to get data on what percentage of their aggregate disbursements, do states in India spend on development expenditure. I got the data from the Reserve Bank of India’s website. I had to clean the data a little for easy handling in R. Here’s the cleaned data.

I used the choroplethr package designed by Ari Lamstein and Brian P Johnson to animate the data on the map of India. Here’s my code followed by output maps.

## load the requisite libraries into R
library("xlsx")
library("choroplethr")
library("choroplethrAdmin1")
library("ggplot2")
indianregions <- get_admin1_regions("india")
## gets dataframe of 2 columns with name of country ("india") throughout column 1
## and name of regions in 2nd column
nrow(indianregions)
## counts the number of regions under country "india"
setwd("C:/Anirudh/Coding/R/Practice/Practice Iteration 2")
df_dev_indicators <- read.xlsx("statewise_development_indicators.xls", sheetIndex = 1, colIndex = 2:5, rowIndex = 2:31, header = FALSE)
## reads excel data into an R dataframe
df_dev_indicators_2012 <- df_dev_indicators[c(1,2)]
df_dev_indicators_2013 <- df_dev_indicators[c(1,3)]
df_dev_indicators_2014 <- df_dev_indicators[c(1,4)]
## create 3 separate dataframes from the parent dataframe so as to have 2 columns,
## column 1 for region and column 2 for column 2 for value metric
names(df_dev_indicators_2012) <- c("region","value")
names(df_dev_indicators_2013) <- c("region","value")
names(df_dev_indicators_2014) <- c("region","value")
## assigning column names [required as per choroplethr function]
admin1_choropleth("india", df_dev_indicators_2012, title = "% Expenditure on Development in 2012", legend = "", buckets = 9, zoom = NULL)
## prints the choropleth map for 2012 indicators
southern_states <- c("state of karnataka","state of andhra pradesh", "state of kerala", "state of tamil nadu", "state of goa")
## stores regions that are to be printed as a bucket map
admin1_choropleth("india", df_dev_indicators_2012, title = "% Expenditure on Development in Southern States in 2012", legend = "", buckets = 9, zoom = southern_states)
## zooms into the buckets specified earlier
## --- CONTINUOUS SCALE ---
admin1_choropleth("india", df_dev_indicators_2012, title = "% Expenditure on Development in 2012", legend = "", buckets = 1, zoom = NULL)
admin1_choropleth("india", df_dev_indicators_2013, title = "% Expenditure on Development in 2013", legend = "", buckets = 1, zoom = NULL)
admin1_choropleth("india", df_dev_indicators_2014, title = "% Expenditure on Development in 2014", legend = "", buckets = 1, zoom = NULL)
view raw choroplethr.R hosted with ❤ by GitHub

…and as expected, the lines of code above print out the desired map

Expenditure on Development in Southern States (2012)

In the examples above I set the buckets attribute equal to 9. That set the data in discrete scales. Had I set buckets = 1 instead, we would have got a continuous scale of data.

Expenditure on Development (2012)_continuous

The same for the last 2 fiscal years:

Development Expenditures in the Last 2 Years

For the US, there are amazing packages for county level and ZIP code level detail of data visualization.

Here’s more on the choroplethr package for R and creating your own maps.

Getting Started

I have been searching for good MOOCs to get me started with R and Python programming languages. I’ve already begun the Johns Hopkins University Data Science Specialization on Coursera. It consists of 9 courses (including Data Scientist’s Toolbox, R programming, Getting and Cleaning Data, Exploratory Data Analysis, Reproducible Research, Statistical Inference, Regression Models, Practical Machine Learning and Developing Data Products), ending with a 7-week Capstone Project that I’m MOST excited about. I want to get there fast.

The Capstone would consist of :
  • Building a predictive data model for analyzing large textual data sets
  • Cleaning real-world data and perform complex regressions
  • Creating visualizations to communicate data analyses
  • Building a final data product in collaboration with SwiftKey, award-winning developer of leading keyboard apps for smartphones

I started with the R programming course where I found the programming assignments to be moderately difficult. They were good practice and also time-consuming for me since I haven’t yet gotten used to the R syntax, which is supposedly unintuitive. Anyway, I completed the course with distinction (90+ marks) scoring 95 on 100, losing 5 because I hadn’t familiarized myself with Git / GitHub. I did this course for a verified certificate, which cost me $29, and looks like this:

Coursera rprog 2015

I won’t be paying for any of the remaining courses though, but still will get a certificate of accomplishment for each course I pass. I have alredy begun with Getting and Cleaning Data and Data Scientist’s Toolbox.

I checked today, and it seems Andrew Ng’s Machine Learning course has gone open to all and is self-paced. A lot of people have gone on to participate in Kaggle competitions with what they learnt in his course, so I’d like to experience it — even though it’s taught with Octave / MATLAB. My very short term goal is to start participating in these competitions ASAP.

Kaggle Competitions

I will be learning the basics of Git this week and along with that, about reading from MySQL, HDF5, the web and APIs. I intend to start reading Trevor Hastie’s highly recommended book, Introduction to Statistical Learning.

ISL Cover 2

[DOWNLOAD LINK TO THE BOOK]

Meanwhile, I need to get started with Git and GitHub too, and I found a very useful blog by Kevin Markham and his short concise videos are great introductory material.

Incidentally, I was in a dilemma whether to start with Hastie’s material or Andrew Ng’s course first. This is what Kevin had to say

Hastie or Ng

The only reason I have reservations against Andrew Ng’s course is that its instruction isn’t in R or Python. Also, CTO and co-founder of Kaggle, Ben Hamner mentions here how useful R and Python are vis-à-vis Matlab / Octave.

Ben Hamner on Python R Matlab v2