I have been using Dato’s GraphLab Create for Coursera’s new Machine Learning Specialization that uses Python. Like me, if you’ve been facing trouble obtaining scatter plots on your canvas in GraphLab Create despite the following code:
graphlab.canvas.set_target('ipynb')
…then no worries, there is a quick fix. I’ve been deliberately lousy with the presentation, so sorry about that. Chances are that no one’s going to end up reading this anyway. I saw this problem being discussed on a Dato forum, so I decided to blog about the fix.
EDIT: Note that this problem is in GraphLab Create v1.6 only. They came up with v1.6.1 a few days after the problem was escalated on their forum, so a good option would be to upgrade GraphLab Create.
The problem you face should looks something like this (click images below to enlarge):
To solve the problem:
Locate sframe.py from your home directory by searching for it from your desktop environment (applies to Windows users too). I found it in the following path on my computer:
~/anaconda/lib/python2.7/site-packages/graphlab/canvas/views
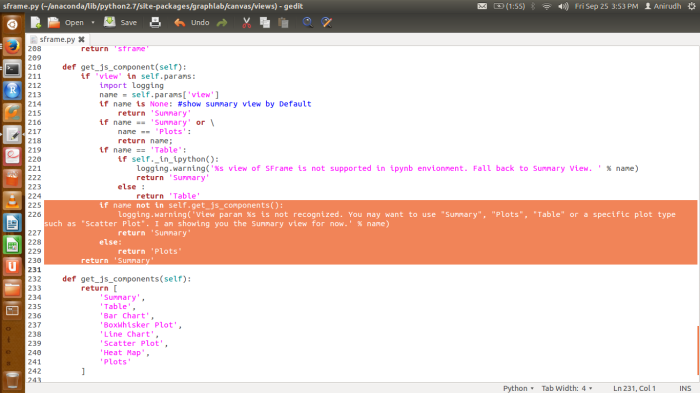
The file sframe.py should look like this:
Then replace the code in lines 255-227 of the opened .py file with the code highlighted below:
This should take care of the problem for good.
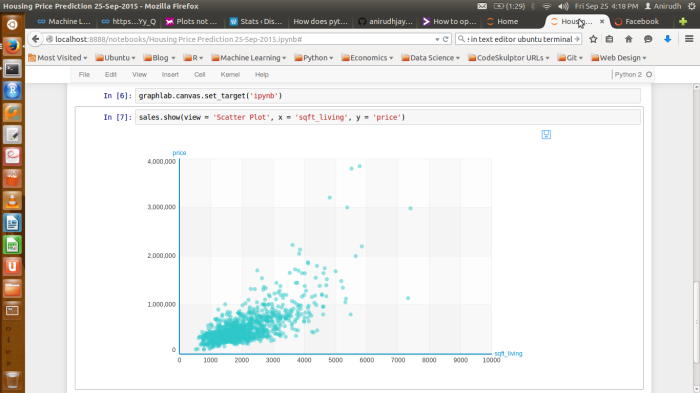
Now you have your desired result:


Thanks Anirudh! I appreciate your effort to solve the problem, but for beginners with little programming background like me it’s really hard to follow what’s going on in the figures. I’m working on Windows and some of your initial commands didn’t work in the cmd prompt so I am unable to follow the rest.
If I have understood properly, there’s a file called “sframe.py” that has to be modified. Could it be done in some other way?
Thank you!
Sergio
LikeLike
I’ve tweaked the post after your comment, to render clarity as to what is the crux of the problem that needs fixing.
LikeLike
Hi Sergio,
Yes, my solution is rather beginner-unfriendly. This post is unnecessarily convoluted. I usually tend to look at this blog as a sort of daily-diary where I simply document problems I faced, and measures I took to rectify them.
Having said that, you have understood it correctly. If you’re on Windows, all you have to do is find / search sframe.py and edit lines 255-257 with the code shown as highlighted in one of the images of this blog post. For that you can use the search bar in Windows, from your home / user directory, containing the Anaconda directory, make the edit, and you’re good to go.
LikeLike
Hi Anirudh,
It worked perfectly. Thank you very much!!!
LikeLiked by 1 person
Hi,
I am getting such error
graphlab.canvas.set_target(‘ipynb’)
x2.show(view=”Scatter Plot”, x=”sq_ft”, y=”price”)
error message
Not enough data to show a scatter plot. Scatter plot requires at least two numerical columns and at least one value.
please suggest me solution
LikeLike