Choropleths are thematic maps shaded or patterned in proportion to the measurement of the statistical variable being displayed on the map, such as population density or per-capita-income.
This post is about creating quick choropleth maps in R, with macroeconomic data across geographies.
As a sample exercise, I decided to get data on what percentage of their aggregate disbursements, do states in India spend on development expenditure. I got the data from the Reserve Bank of India’s website. I had to clean the data a little for easy handling in R. Here’s the cleaned data.
I used the choroplethr package designed by Ari Lamstein and Brian P Johnson to animate the data on the map of India. Here’s my code followed by output maps.
| ## load the requisite libraries into R | |
| library("xlsx") | |
| library("choroplethr") | |
| library("choroplethrAdmin1") | |
| library("ggplot2") | |
| indianregions <- get_admin1_regions("india") | |
| ## gets dataframe of 2 columns with name of country ("india") throughout column 1 | |
| ## and name of regions in 2nd column | |
| nrow(indianregions) | |
| ## counts the number of regions under country "india" | |
| setwd("C:/Anirudh/Coding/R/Practice/Practice Iteration 2") | |
| df_dev_indicators <- read.xlsx("statewise_development_indicators.xls", sheetIndex = 1, colIndex = 2:5, rowIndex = 2:31, header = FALSE) | |
| ## reads excel data into an R dataframe | |
| df_dev_indicators_2012 <- df_dev_indicators[c(1,2)] | |
| df_dev_indicators_2013 <- df_dev_indicators[c(1,3)] | |
| df_dev_indicators_2014 <- df_dev_indicators[c(1,4)] | |
| ## create 3 separate dataframes from the parent dataframe so as to have 2 columns, | |
| ## column 1 for region and column 2 for column 2 for value metric | |
| names(df_dev_indicators_2012) <- c("region","value") | |
| names(df_dev_indicators_2013) <- c("region","value") | |
| names(df_dev_indicators_2014) <- c("region","value") | |
| ## assigning column names [required as per choroplethr function] | |
| admin1_choropleth("india", df_dev_indicators_2012, title = "% Expenditure on Development in 2012", legend = "", buckets = 9, zoom = NULL) | |
| ## prints the choropleth map for 2012 indicators | |
| southern_states <- c("state of karnataka","state of andhra pradesh", "state of kerala", "state of tamil nadu", "state of goa") | |
| ## stores regions that are to be printed as a bucket map | |
| admin1_choropleth("india", df_dev_indicators_2012, title = "% Expenditure on Development in Southern States in 2012", legend = "", buckets = 9, zoom = southern_states) | |
| ## zooms into the buckets specified earlier | |
| ## --- CONTINUOUS SCALE --- | |
| admin1_choropleth("india", df_dev_indicators_2012, title = "% Expenditure on Development in 2012", legend = "", buckets = 1, zoom = NULL) | |
| admin1_choropleth("india", df_dev_indicators_2013, title = "% Expenditure on Development in 2013", legend = "", buckets = 1, zoom = NULL) | |
| admin1_choropleth("india", df_dev_indicators_2014, title = "% Expenditure on Development in 2014", legend = "", buckets = 1, zoom = NULL) |
…and as expected, the lines of code above print out the desired map

In the examples above I set the buckets attribute equal to 9. That set the data in discrete scales. Had I set buckets = 1 instead, we would have got a continuous scale of data.

The same for the last 2 fiscal years:

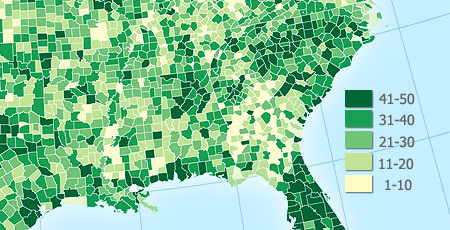
For the US, there are amazing packages for county level and ZIP code level detail of data visualization.
Here’s more on the choroplethr package for R and creating your own maps.

Hi Anirudh. I too am going through the Coursera Data Science program and am learning programming for the first time. I studied Economics as an undergraduate, and though I don’t work in the field, I still have a lot of interest in Economics. It’s great to see a fellow “newb” interested in some of the same stuff documenting their learning experience.
I look forward to reading your future posts!
LikeLike
Hi Keith!
Thanks for going through this blog. Indeed, it seems worth the effort, keeping a log on one’s progress.
My main motivation to start on this path was to understand and work with machine learning while pursuing higher studies in economics. In fact, Google’s chief economist, Hal Varian, in a paper dated June 2013 says, “In this essay I will describe a few of these tools for manipulating and analyzing big data. I believe that these methods have a lot to offer and should be more widely known and used by economists. In fact, my standard advice to graduate students these days is, go to the computer science department and take a class in machine learning“
LikeLike
Good luck with your recovery and the blog. I just looked at your piece on chloropleths and feel like making this comment. There are a lot of people that blog on technical topics. Most of the time, it’s a case of “I have just learnt to do something with the help of N resources and blog about how I did it.” More often than not, these blogs are sloppy because the author has just learnt something and is not mature enough to say anything new and/or intelligent about it. And, often, they tend to propagate any misconceptions the blogger may have on the topic. I personally was burnt more than once by taking a blogger’s word for it. So, my suggestion would be: do blog but please error check what you blog and revise the blogs as you update your knowledge.
Having said all the above, does your script above run as-is? (Assuming one installs the necessary R packages, of course). For example, how does the line: indianregions (“india”) work?
LikeLiked by 1 person
hi John! thanks for your observation. I’ll keep that in mind for future posts, and I can very well see your point.
I could have sworn that the code I had written was
get_admin1_regions(“india”) which DOES work and the rest of the code should work for whatever data you use. I made that edit, so thanks for bringing it to my notice.
LikeLike
John, I wished to point out one more thing, something I noticed just yesterday – I use http://www.inside-r.org/pretty-r/tool for posting my code, and it doesn’t seem to be robust / reliable. It messes up the code whenever I try editing the blog post. That’s what changed my code.
LikeLike
Hi Anirudh,
Thanks for the post! I tried recreating your code. When I run the code, I get a choropleth map without any shading. It’s because I got warnings saying that none of the state names in the ‘indiaregions’ data set matches with those in my data set from RBI. I realize that using the ‘get_admin1_regions’ function, we get a data frame which has the state names preceded by ‘state of’ or ‘union territory of’. Did this cause any error for you too? Is there an easy way I could tackle this? Thanks!
LikeLike
Hi Aditya,
Thanks for going through this post. You are absolutely right in pointing this out. As it happens, I DID alter the names of the states to ‘state of …’ and ‘union territory of…’ in the RBI data.
In particular, this the altered data that I used:
https://docs.google.com/spreadsheets/d/1gaZ7ByUe0TbX2_OlYY7IK40W6sVQ3rl0_hZys5DOfxE/edit?usp=sharing
LikeLike
I have also added the link to my blog post. Thanks for indirectly pointing out the need for the same! 🙂
LikeLike